In Running Results Presentations in System Builder

Info:

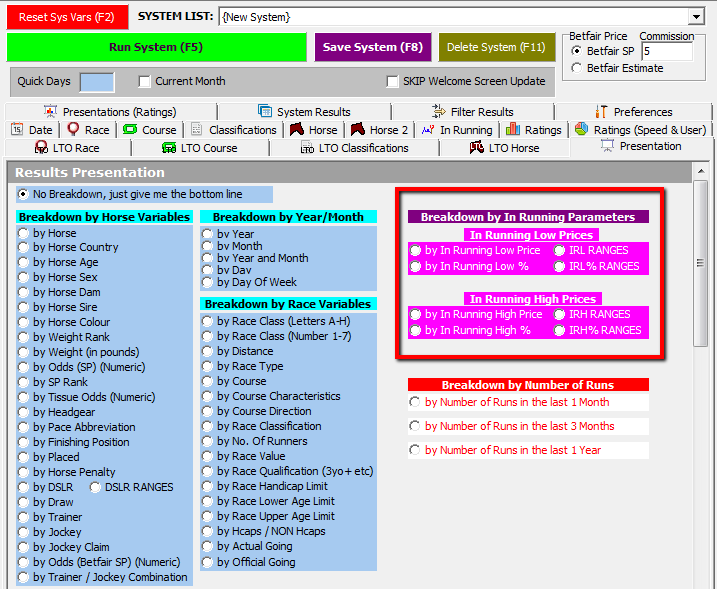
by In Running Low Price
This results presentation will output your system results presented by the In Running Low Prices.The In Running Low Price presentation can be used for many research ideas using the full scope of the system builders parameters.

IRL Ranges
This results presentation will output your system results presented by the In Running Low Prices grouped into ranges of price ranges.

The price ranges are as follows:-

IR Low N/A (signifies no price available)
1.01
1.02-1.10
1.11-1.20
1.21-1.30
1.31-1.40
1.41-1.50
1.51-1.60
1.61-1.70
1.71-1.80
1.81-1.90
1.91-2.00
2.01-2.20
2.21-2.40
2.41-2.60
2.61-2.80
2.81-3.00
3.01-3.50
3.51-4.00
4.01-4.50
4.51-5.00
5.01-5.50
5.51-6.00
6.01-6.50
6.51-7.00
7.01-7.50
7.51-8.00
8.01-8.50
8.51-9.00
9.01-9.50
9.51-10.00
10.01-15.00
15.01-20.00
20.01-30.00
30.01-40.00
40.01-50.00
50.01-70.00
70.01-100.00
100.01-250.00
250.01-500.00
500+

by In Running Low %
This results presentation will output your system results presented by the percentage difference from Betfair SP to Low Price In Running.

IRL % Ranges
This results presentation will output your system results presented by the percentage difference from Betfair SP to Low Price In Running in ranges of percentages

The range bands are as follows

>=99.00%
90.00% to 98.99%
80.00% to 89.99%
70.00% to 79.99%
60.00% to 69.99%
50.00% to 59.99%
30.00% to 49.99%
10.00% to 29.99%
9.99% and lower

It is often easier to look at the Low In Running percentages in the ranges view


by In Running High Price
This results presentation will output your system results presented by the In Running High Prices.

You could use this presentation to look at individual horses high trading prices when winning or to see if any particular course helps horses win at inflated prices in running under certain conditions.

IRH Ranges
This results presentation will output your system results presented by the In Running High Price Ranges

The price ranges are as follows:-

IR High N/A (signifies no price available) 
1.11-1.20
1.61-1.70
1.71-1.80
1.91-2.00
2.01-2.20
2.21-2.40
2.41-2.60
2.61-2.80
2.81-3.00
3.01-3.50
3.51-4.00
4.01-4.50
4.51-5.00
5.01-5.50
5.51-6.00
6.01-6.50
6.51-7.00
7.01-7.50
7.51-8.00
8.01-8.50
8.51-9.00
9.01-9.50
9.51-10.00
10.01-15.00
15.01-20.00
20.01-30.00
30.01-40.00
40.01-50.00
50.01-70.00
70.01-100.00
100.01-250.00
250.01-500.00
500+

by In Running High %
This results presentation will output your system results presented by the percentage difference from Betfair SP to High Price In Running.

IRH % Ranges
This results presentation will output your system results presented by the percentage difference from Betfair SP to High Price In Running in ranges of percentages.

The percentages ranges are as follows:-

IR High Perc N/A (signifies no price available) 
<0%
0% to 100%
101% to 200%
201% to 300%
301% to 400%
401% to 500%
601% to 750%
751% to 999%
1000% and Higher

Loop Research Odds (START) and (END) (In Running Tab)

Info:

Use the lowest in running start and end filters to loop around a range of research odds.

Lets say you want to look at a course and see how various in running low odds workout for blanket laying of the field.

You would choose your course and your range of in running low odds, so that might be Towcester and 1.02 to 1.30.

You would choose your course from the course tab and then enter 1.02 in the low ir start box and 1.30 in the end box and click the loop button.

This would then run system builds for each of the research odds and show you the returns to laying the field at each of the odds.

You can also set the loop increment to whatever jumps in price you require.

Module 1.6 – How the Race Worked Out

Info:

In this sixth module we look at the feature How the Race Worked Out in The Form Book.

How the Race Worked Out allows you to quickly see how the form of a race has worked out, the comments in running for a race and any entered horse or race notes, without
having to double click into the full race details and use the post form tab.

Proform Release Notes for V1.91 build.10

Info:

Proform Release Notes for V1.91 build.10


New Features Summary

  1. Corrected PRB calculations.
  2. Added user Rating 1 Rank to today’s runners quick view.
  3. Added WAX, PRB and PRB^2 to system builder.
  4. fPRB^2 added to race card and results screen. Works with form and quick filters
  5. PRB^2 added to horse form screen. Works with form and quick filters.
  6. PRB and PRB^2 added to prior form screen. Works with form and quick filters.
  7. PRB and PRB^2 added to in running screen. Works with form and quick filters.
  8. PRB and PRB^2 added to today’s runners screen. Works with form and quick filters.
  9. Added PRB to pattern matcher and trainer trends screens and re-sized them all to fit better.
  10. Added four research buttons to horse 2 tab for research past Cheltenham Festival Runners and winners. NOTE: They do not save with a system at present so are just for research.
  11. Colour coded WAX, PRB and PRB^2 on all screens as follows: -

WAX
GREEN: Better than +2
RED: Worse than -2
AMBER otherwise

PRB
GREEN: Better than 55%
RED: Worse than 45%
AMBER otherwise

PRB^2
GREEN: Better than 40%
RED: Worse than 30%
AMBER otherwise


Field Explanations

PRB - This is the average PRB of all starts, calculated for each race, so that the performance each race is weighted the same.

This new metric is more powerful than traditional strike rates. This is because strike rate uses wins which is very black and white i.e. a win counts as 1 but a loser regardless of finishing position, even if second counts as 0.

PRB^2 – This is the average of the percentage of rivals beaten squared.

PRB^2 is in effect PRB weighted so that each successive placing going down the field from the winner is less important. PRB^2 predicts future winners for any racing statistic better than PRB.

WAX – Wins above Expectations which is calculated like this, actual winners minus expected winners.